Organization overview
The Organization overview provides an overview of the repositories belonging to your Git provider organization that you follow on Codacy. Here you can compare their statuses and check for items that require your attention.
To access your Organization overview, select an organization from the top navigation bar and select Overview on the left navigation sidebar.
Use the drop-down list at the top of the page to filter the information displayed on all dashboard areas based on the repositories that you select. For example, you can use the filter to monitor the quality of the repositories maintained by specific teams or that include certain programming languages, or to ignore legacy repositories that are no longer maintained. The selected repositories are stored in your browser so that the same filter is applied between your visits to the Organization overview page.
On the Organization overview you have the following areas to help you monitor your repositories:
On this page, you can also see the Organization setup area, which provides you with a checklist of items that you should complete to ensure that your organization is set up correctly and that you're getting the most out of Codacy.
The following sections provide a detailed description of the repository-related dashboard areas.
You can use the Codacy API to generate reports or obtain information
about the code quality of your repositories in a more flexible way.
For more information see the list of
available API endpoints
and the following examples:
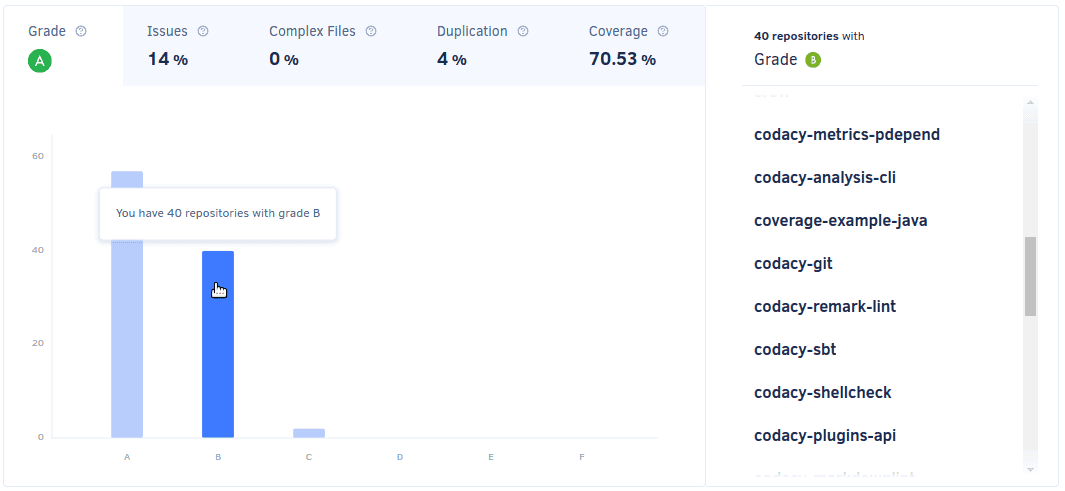
Overall quality chart
The Overall quality chart compares the repositories that you follow regarding grade, issues, complex files, duplication, and code coverage. Each tab displays the average value for the corresponding metric for the last updated repositories.
-
The overall quality chart calculates metrics and displays data only for the repositories that you follow on Codacy. This means that depending on their list of followed repositories, two users can see different results on this chart.
-
The overall quality chart displays information for at most the last 100 updated repositories.

- Hover the mouse pointer over the bars to see the metrics for the corresponding repositories.
- Click the bars to navigate directly to the corresponding repository.
If you have over 8 repositories, the chart displays your repositories grouped by grade or percentage intervals. Click the bars to see and navigate directly to the corresponding repositories.
If you don't have coverage set up for any of your repositories yet, the coverage tab provides you with instructions on how to add coverage for your repositories.
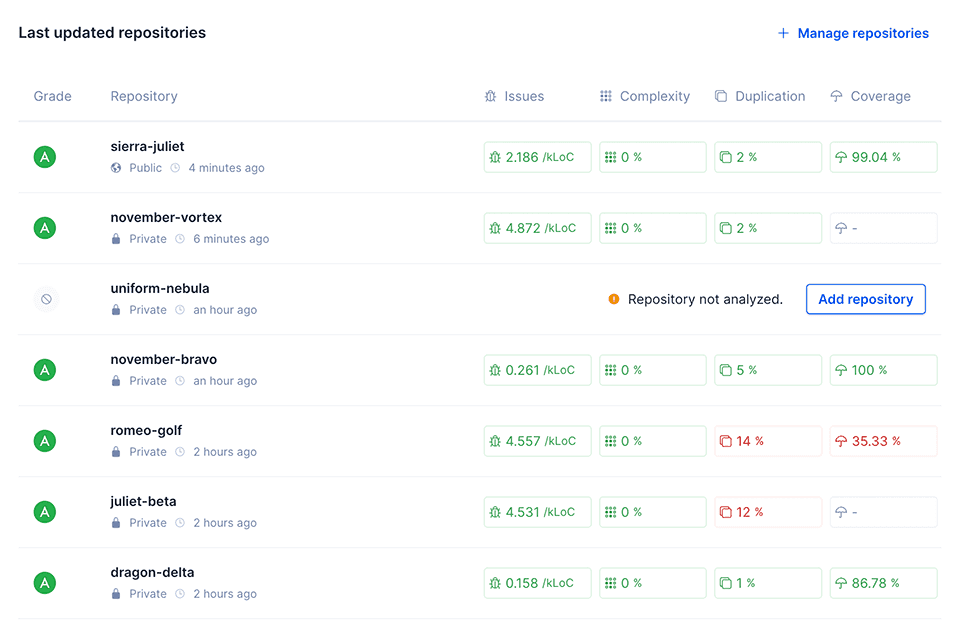
Last updated repositories
The Last updated repositories list displays the last updated repositories, sorted by reverse date of the last update.
The exact value of the last updated date of the repositories depends on your Git provider:
- GitHub: date of the last commit to any branch of the repository (value of
pushed_atfrom the GitHub Repositories API). - GitLab: date when the project was last updated (value of
last_activity_atfrom the GitLab Groups API). Note that this value is only updated at most once per hour). - Bitbucket: date when the repository was last updated (value of
updated_onfrom the Bitbucket Repositories API). On Bitbucket Server Codacy can't obtain this information and the list displays the repositories in alphabetical order.